From failure to fix: Diagnose Kubernetes Node and Pod problems with Site24x7
Picture a busy Monday morning. You are working on leftover projects from the previous week, and assuming everything is fine with your applications as you had not received support tickets during the weekend. All of a sudden, during the middle of the day, you get a flood of reports from users who complain about slow response in your application...
Server monitoring checklist
Do you ever look at the list of metrics you monitor and feel overwhelmed? That is a nice problem to have instead of needing to tweak your server performance KPIs because your server monitoring tool does not monitor them. With Site24x7's server monitoring suite, it is easy to be spoiled for choice when it comes to which metric to mon...
Top 8 web server monitoring best practices
In this blog, we'll explore the best practices for monitoring web servers such Apache, NGINX, IIS, Tomcat, and more.
Starting with the basics, it's important to track uptime to check if your server is even online. Be sure to check response time, too, as this directly contributes to a user’s first impression—slow lo...
Monitoring AWS ElastiCache for real-time app demands
Real-time apps, like e-commerce platforms, gaming systems, or live streaming services, thrive on speed and responsiveness. AWS ElastiCache, an in-memory caching solution, drives these apps by providing fast data access with low latency, reducing database strain and scaling effortlessly. Yet, to ensure your app runs smoothly, monitoring Elasti...
Troubleshooting latency issues in event-driven architectures
Particularly, in architectures that are event driven, latency can cause bottlenecks in microservices, impact transaction speeds, and reduce the efficiency of event-driven workflows.
In this blog, we will explore the common causes of latency in event-driven architecture and provide effective troubleshooting techniques. Plus, we will see ...
Utilizing browser emulation and automation languages in digital experience monitoring
By mimicking user behavior across several browsers and devices, browser emulation offers a more close to realistic evaluation of the digital experience. Its multi-browser testing feature makes it possible to find rendering, JavaScript execution, and CSS handling issues in a variety of browsers, including Chrome, Firefox, Safari, and Edge. By ...
Debugging performance issues in Azure Service Bus
Azure Service Bus is a critical messaging service for building scalable cloud applications, but performance bottlenecks can lead to delayed message processing, throttling, or even dropped messages. It is essential to identify and resolve these issues to maintain smooth application workflows and prevent downtime. This blog explores common Azur...
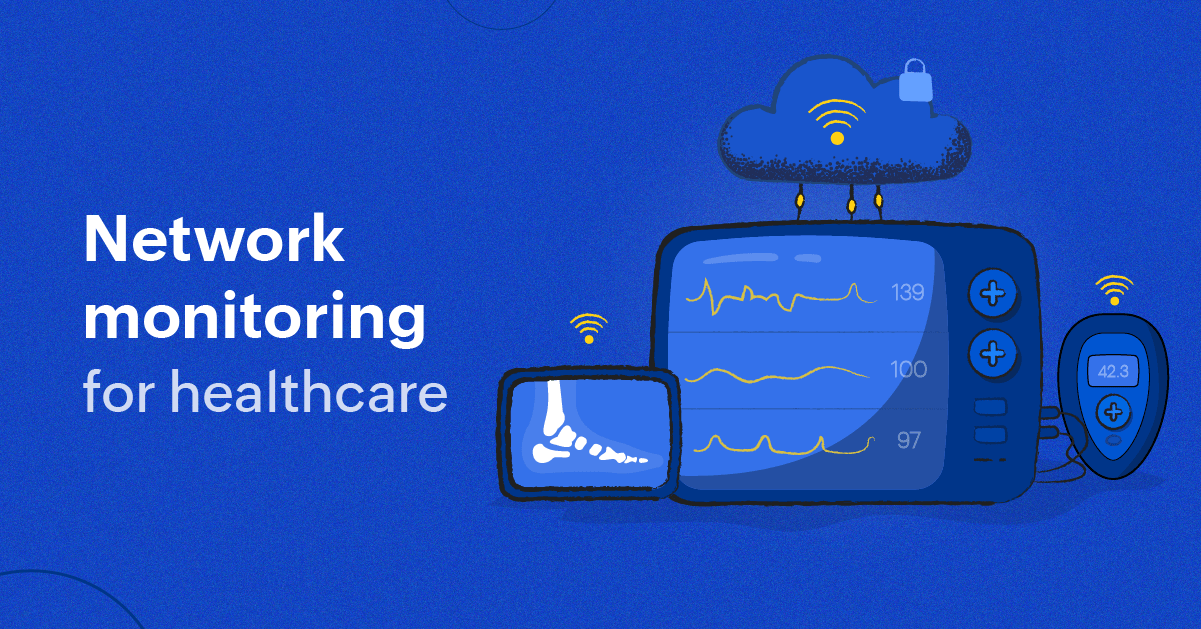
Leveraging AI for enhanced network monitoring in healthcare: A guide for CXOs
During emergencies and illnesses, people expect intuitive healthcare services. When multiple tests and reports are involved, patients anticipate that the results will be available to their doctors instantly for quick diagnoses. Waiting for a paper copy of each test result is not feasible.
Patients feel that they are in safe hands if the...
Decoding AI-led event correlation for mastering modern IT management
All events are not incidents; think about it. In IT observability , an event is any detectable occurrence or change within a system—such as a server request, API call, error log, or security breach. These events are a vital ingredient of IT observability—the ability to look into how a system functions from the outside. When c...
