VMware VeloCloud SD-WAN monitoring
VMware VeloCloud SD-WAN is a software-defined wide area network (SD-WAN) solution that optimizes network performance and security. It helps streamline the deployment of hybrid WAN connections, improve application performance, and simplify network administration through centralized orchestration and policy-based control. VMware VeloCloud SD-WAN monitoring tools help IT teams proactively identify and address network issues, optimize traffic routing, and ensure a seamless user experience. Site24x7 provides monitoring for VMware VeloCloud SD-WANs, including edges and entire customer networks.
Common terms
- VMware VeloCloud SD-WAN Edge (VCE): A single network device that forms the endpoint of a SD-WAN. It is configured in the Orchestrator interface and does not require any intervention from network administrators for installation.
- VMware VeloCloud SD-WAN Gateway (VCG): A multi-tenant virtual appliance that forms the end of the overlay tunnels running from both private (MPLS) and public (Internet) paths. Once activated, each edge device automatically finds the closest VCG and connects to any additional VCG required to set up VPN and cloud connectivity.
- VMware VeloCloud SD-WAN Orchestrator (VCO): A centralized management and orchestration platform that allows for easy control and monitoring of networks across a customer account. It orchestrates the data flow through a SD-WAN network and enables provisioning virtual services in VCEs, hubs, and the cloud.
Purpose
Monitoring your VMware VeloCloud SD-WAN environment provides real-time visibility, insight, and control over the performance and operation of the network.
- Track metrics like traffic, status, and more in real time.
- Detect network issues, such as connectivity problems or bandwidth congestion.
- Monitor network usage trends and traffic patterns to anticipate future consumption and plan for capacity.
Use case
Consider an MSP that provides deployment, configuration, monitoring, and maintenance of VMware Velocloud SD-WAN solutions for their clients. Managed service providers (MSPs) can utilize Velocloud monitoring to efficiently manage and monitor their customer networks, ensuring optimal performance and security. This monitoring capability enables MSPs to offer enhanced network management services, reduce downtime, and provide a high level of service quality, ultimately increasing customer satisfaction and loyalty.
Scope
Site24x7 periodically collects data from the VMware VeloCloud SD-WAN environment via REST API. The collected data includes VCE device availability, interface status, and traffic, which are then displayed for easier analysis.
Prerequisites
- An Orchestrator API key with read-only privileges that has access to all the edges/customers you wish to monitor
- The VMWare VeloCloud SD-WAN Orchestrator URL or IP Address with the http:// or https:// prefix. For example: https://vco123.velocloud.net
How it works
When you add a device to Site24x7, it connects to your VMware VeloCloud SD-WAN network using the provided API key. It then fetches data using the API for the monitors and displays the relevant metrics.
Adding a VMware VeloCloud SD-WAN monitor
To begin monitoring, add your VMware VeloCloud SD-WANs to Site24x7.
Viewing the monitor summary
- Log in to your Site24x7 account.
- Navigate to SDN > VeloCloud, then click VeloCloud SD-WAN.
- Click the required monitor to view the monitor Summary.
- Click Availability or Downtimes to view the Availability Summary Report. Response Time and Orchestrator Details are also available on the page.
Viewing the details for customers
- Navigate to SDN > VeloCloud > VeloCloud SD-WAN.
- Click the required monitor.
- Navigate to the Customers tab.
- On this tab, you can view Customer Name, Customer ID, Connected Edges, Degraded Edges, Down Edges, Stable Links, Unstable Links, and Down Links.
- Clicking a Customer Name will navigate you to the monitor summary page of the customer.
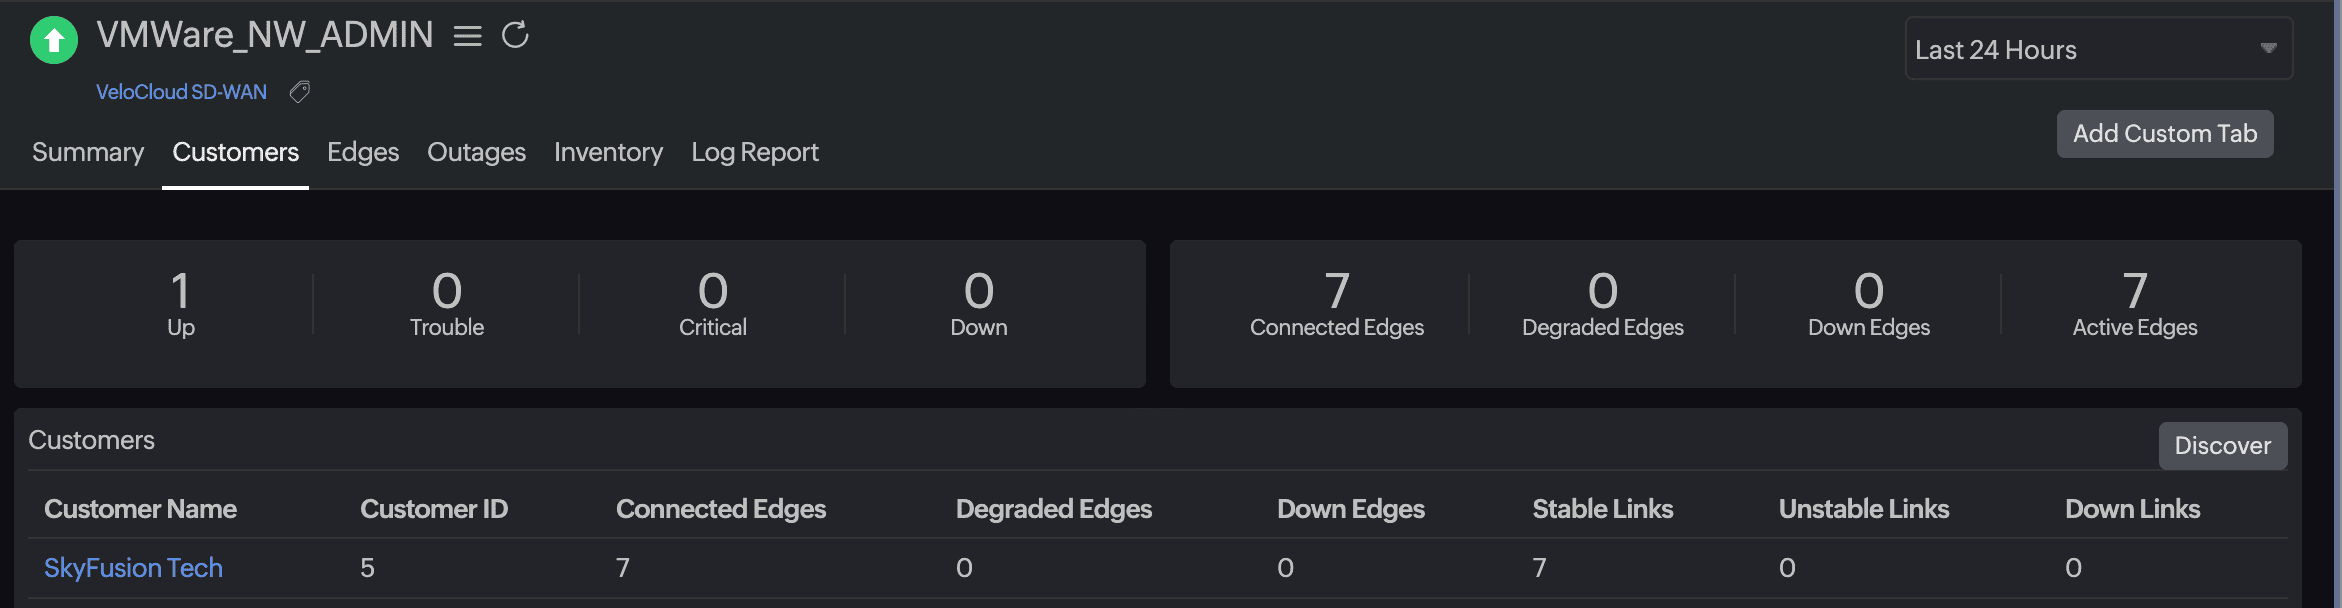
- Click the Discover button at the top-right of the table to discover more customers within the SD-WAN.
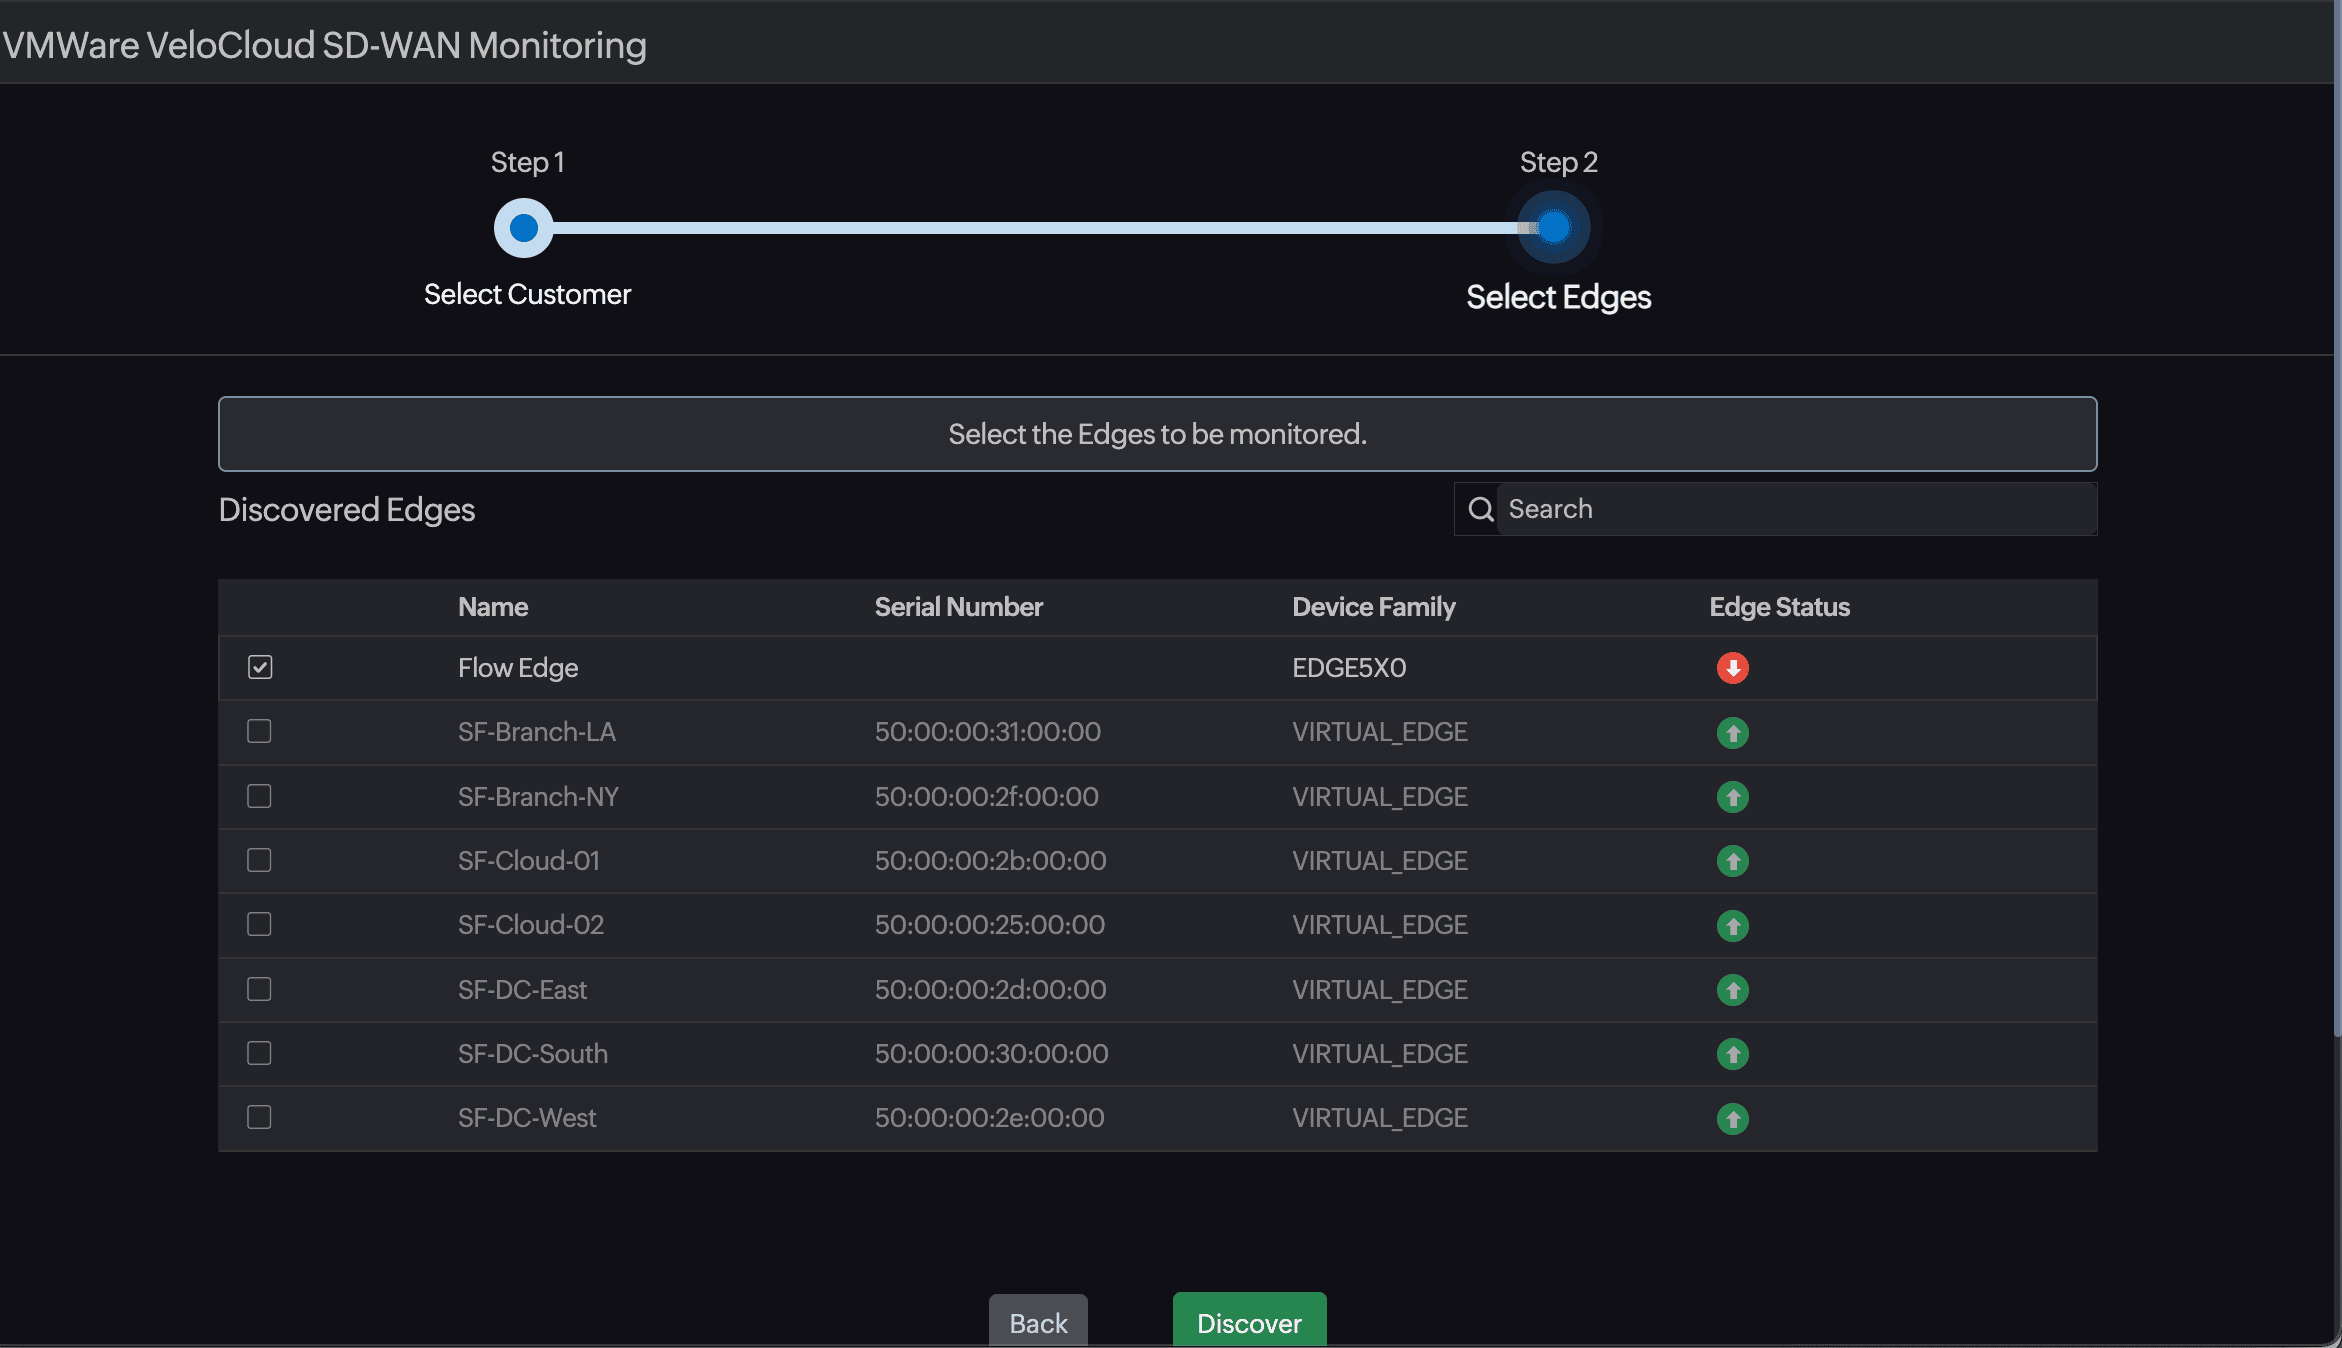
- Upon clicking Discover, you will be asked to select a customer.
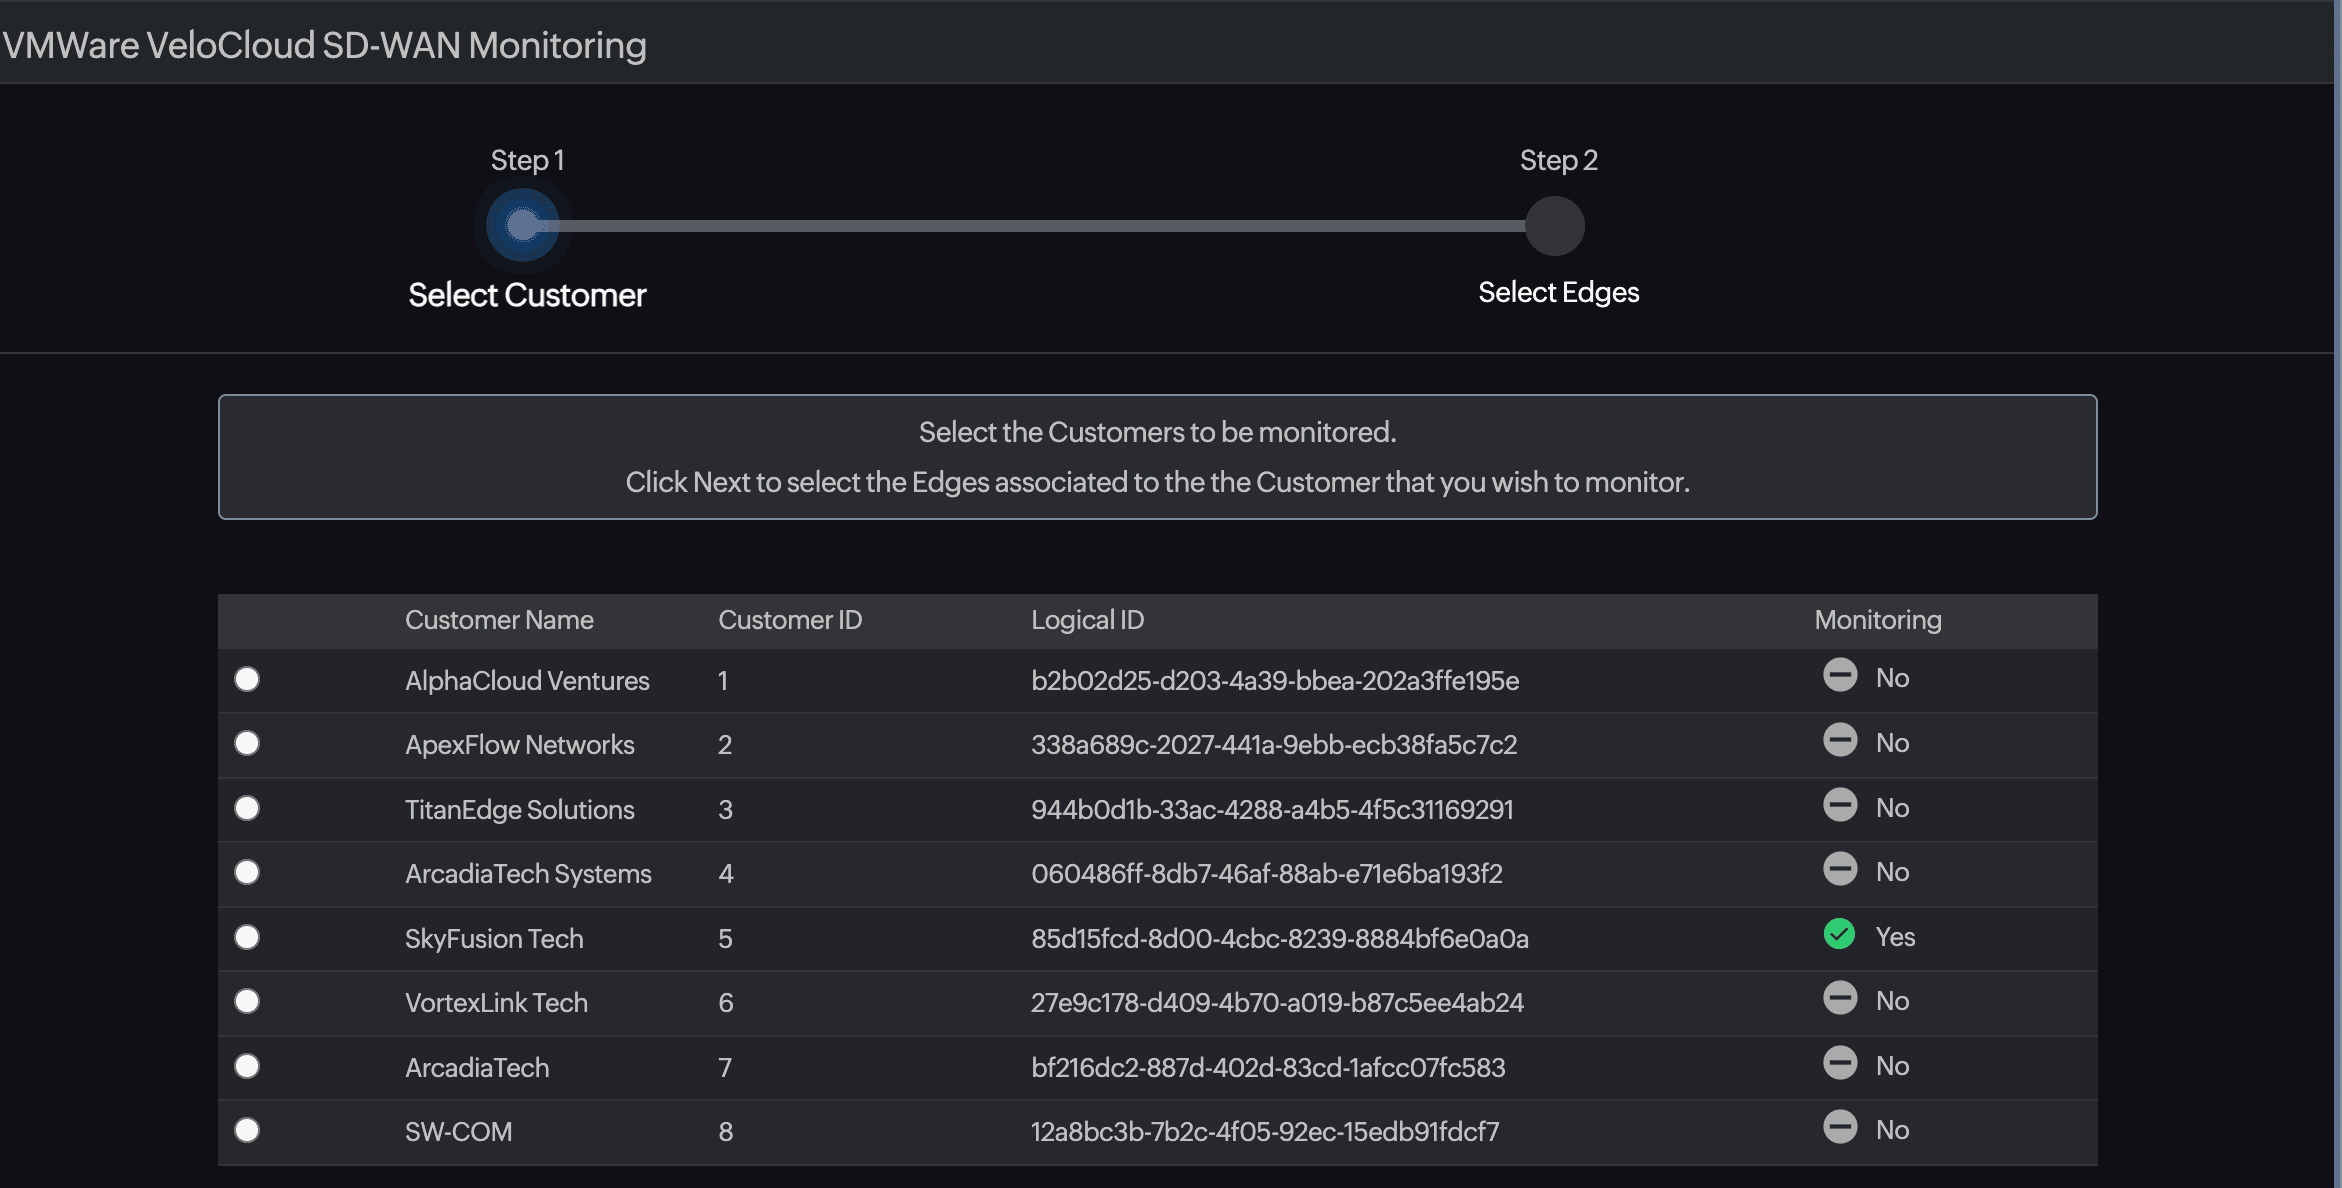
- After clicking Next, select the edges within the customer account that you want to add for monitoring.
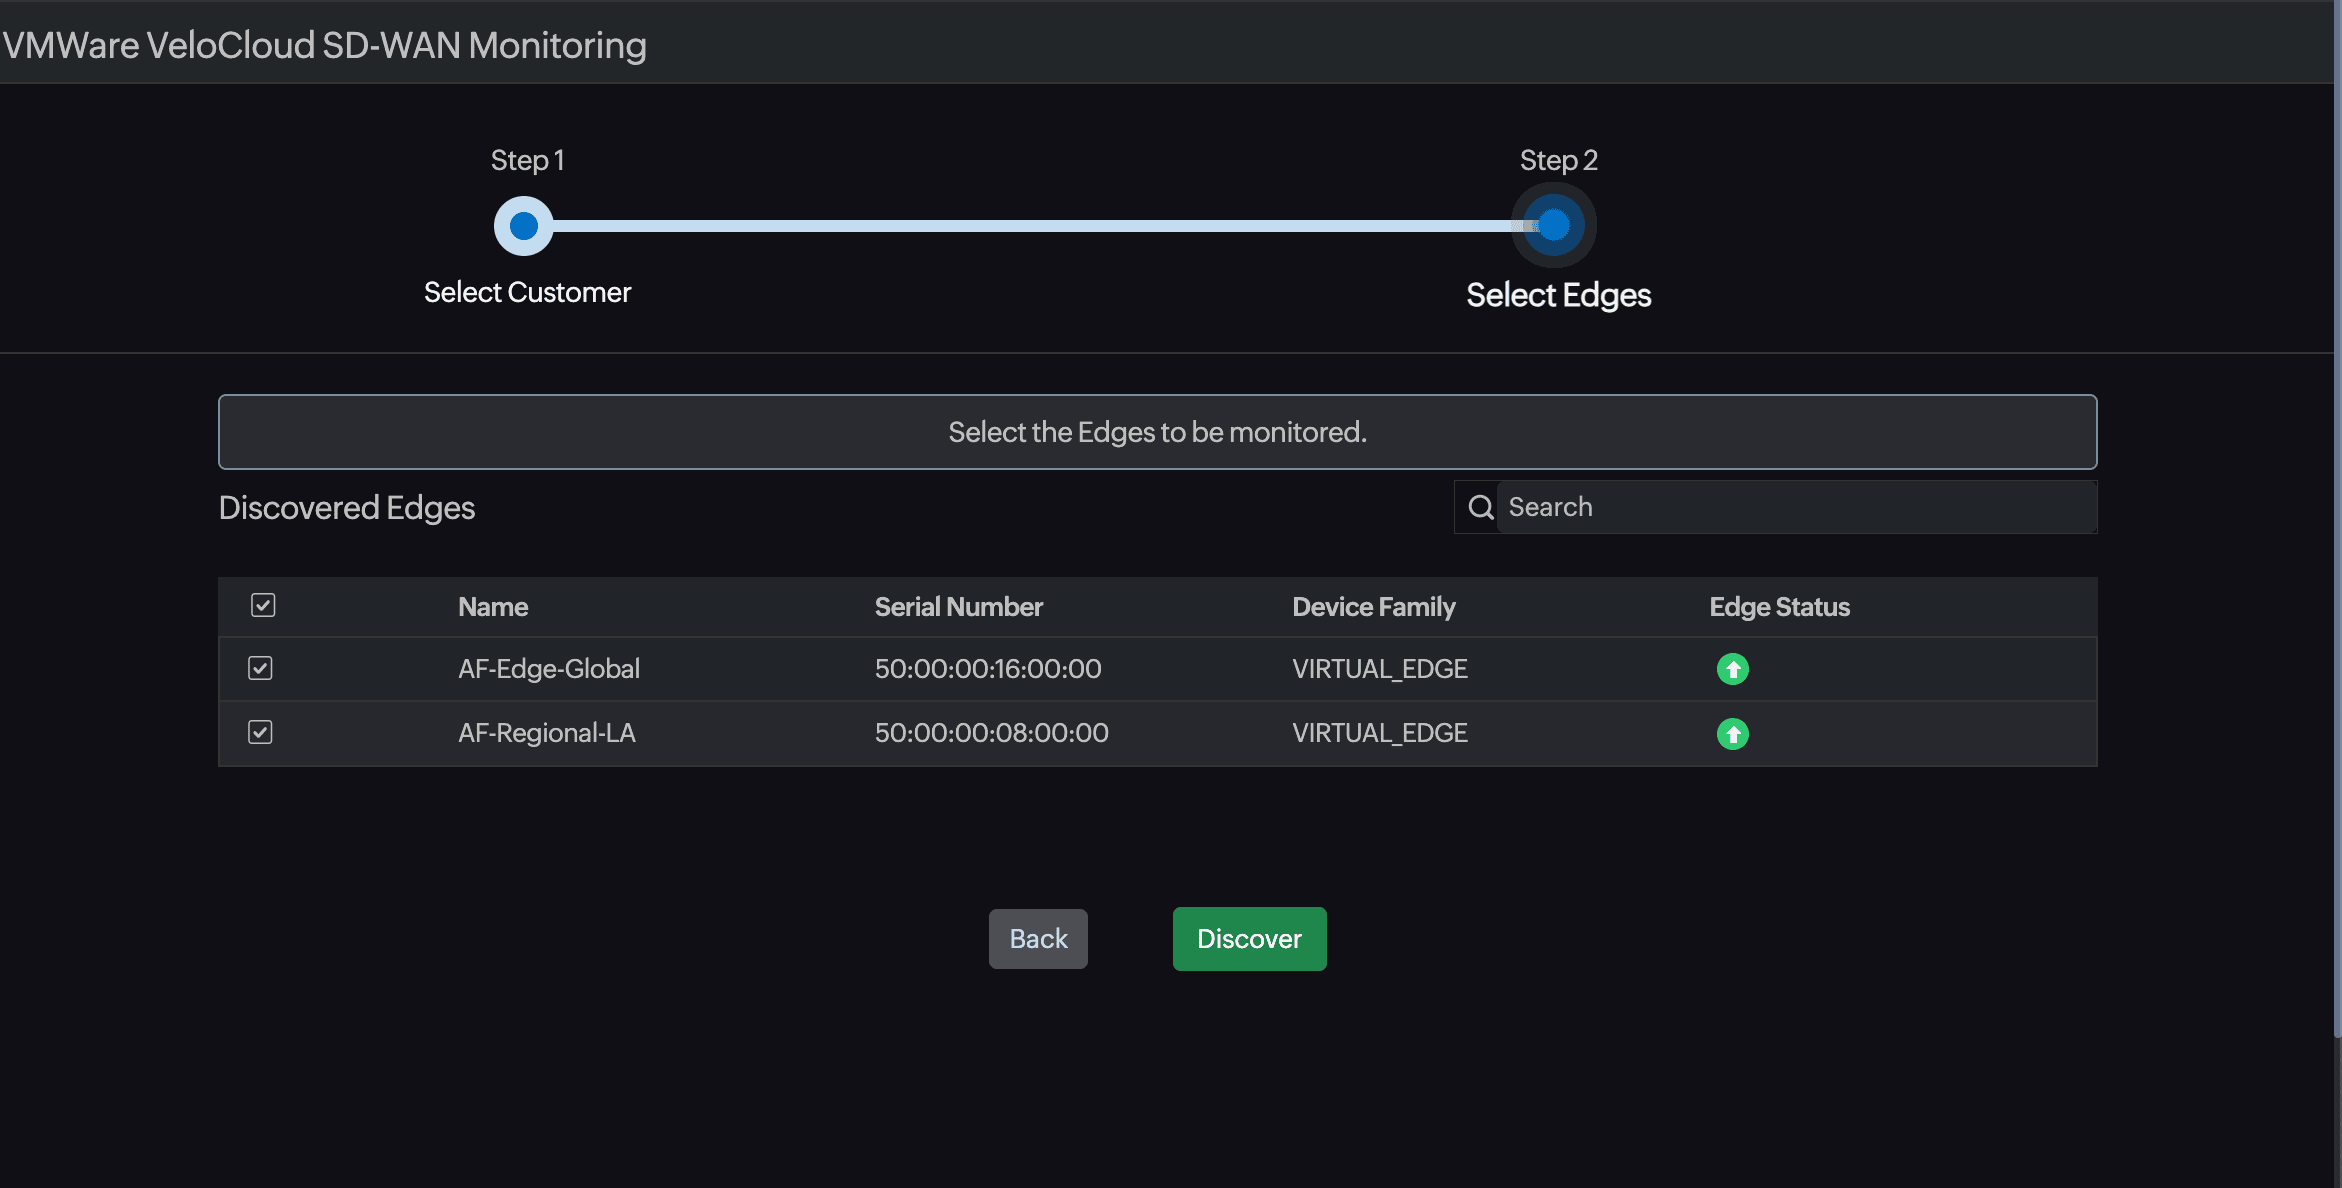
- Then, click Discover.
- Upon clicking Discover, you will be asked to select a customer.
Viewing the details for edges
- Navigate to SDN > VeloCloud > VeloCloud SD-WAN.
- Click the required monitor.
- Navigate to the Edges tab.
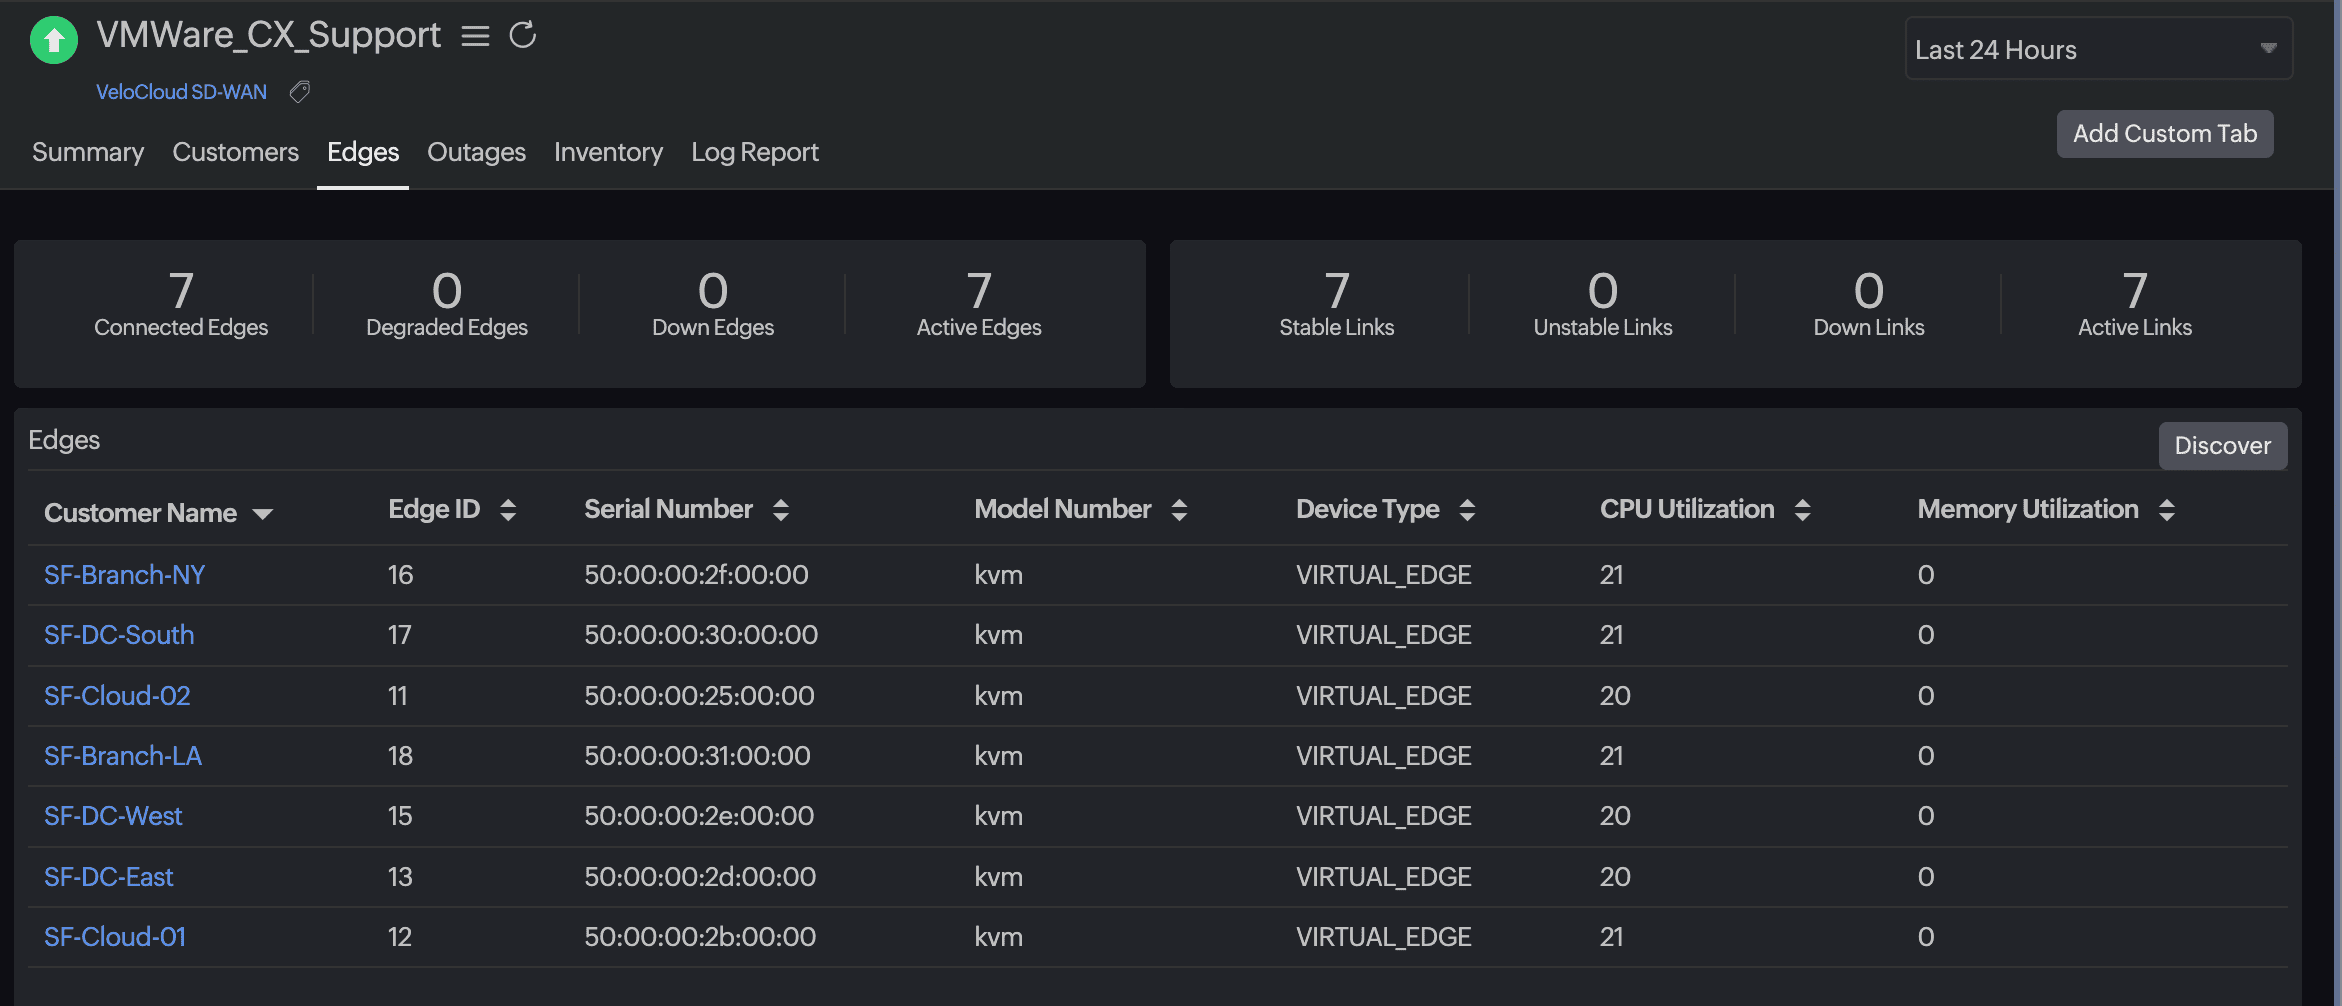
- On this tab, you can view Customer Name, Edge ID, Serial Number, Model Number, Device Type, CPU Utilization, and Memory Utilization.
- Clicking an Edge Name will navigate to the monitor summary page of the edge.
- Click the Discover button at the top-right of the table to discover more edges within the SD-WAN.
- Upon clicking Discover, you will be asked to select a customer.
- After clicking Next, select the edges within the customer account that you want to add for monitoring.
- Then click Discover.
Outages
View details about outages and click on a record to add comments as needed.
Inventory
View details about the VMware VeloCloud SD-WAN monitor such as Monitor Licensing Category, Monitoring Locations, Threshold and Availability Profile, Notification Profile, and User Alert Group. You can edit the fields that have a pencil icon beside them. Start a group chat by clicking the chat icon. Add notes by clicking Add Note.
Log Report
View log reports filtered within a required time period and based on availability. Click Download CSV to download the report. Click the table icon to select the required columns.
Reports
Navigate to Reports and then select VeloCloud SD-WAN, VeloCloud Customer, or VeloCloud Edge.
-
Summary Report
-
Links Report
Top N & Bottom N Report
-
VMWare VeloCloud SD-WAN Orchestrators by Response Time
-
VMWare VeloCloud Customers by Response Time
-
Edges by CPU Utilization
-
Edges by Memory Utilization
-
Links by Total Bytes
-
Links by Bytes Received
-
Links by Bytes Sent
-
Links by Total Packets
-
Links by Packets Received
-
Links by Packets Sent
-
Links by Bandwidth Upstream
-
Links by Bandwidth Downstream
-
Links by Jitter Upstream
-
Links by Jitter Downstream
-
Links by Latency Upstream
-
Links by Latency Downstream
-
Links by Packet Loss Upstream
-
Links by Packet Loss Downstream
-
Links by Average Throughput Upstream
-
Links by Average Throughput Downstream
You can also create custom reports by clicking Create Custom Report below all the available reports.